current Research
Southern Ocean 4-D circulation from Argo float and altimeter data
more figures coming soon...
Figure 1: Horizontal distribution of Argo profiles per 4° zonal x 2° meridional bins. Climatological positions of fronts as defined by Orsi et al. (1995) are shown in white.
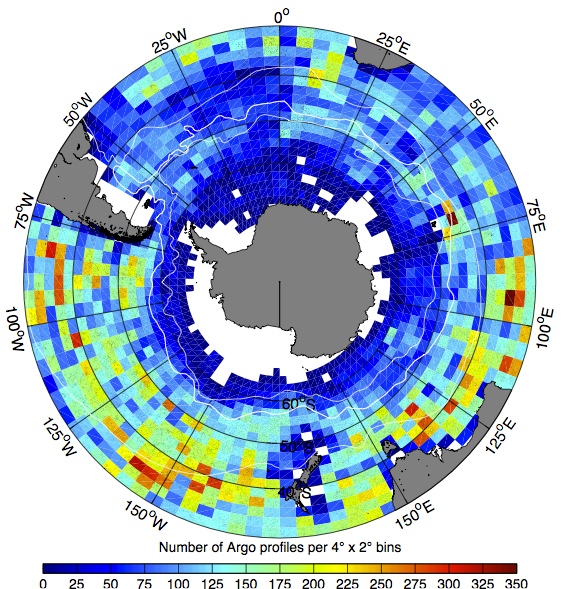
Figure 2: Example of linear regression between SSH′ and hydrographic variables for a cell at 400db located on the Southwest Atlantic region of the ACC (55°S, 314°E).
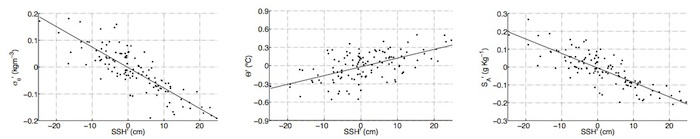
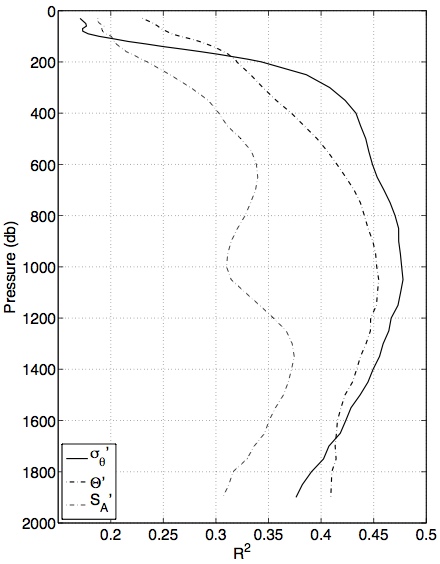
Figure 3: Domain average R2 between SSH' and Potential density (solid line), Conservative Temperature (dash-dot line) and Absolute Salinity (thin dash-dot line) as a function of pressure.